Market Outlook
February 22, 2017
Market Cues
Domestic Indices
Chg (%)
(Pts)
(Close)
Indian markets are likely to open flat and may remain range bound tracking SGX
BSE Sensex
0.3
100
28,762
Nifty and Asian markets.
Nifty
0.3
29
8,908
After moving to the upside early in the session, US markets remained mostly positive
Mid Cap
0.5
71
13,585
throughout the trading day on Tuesday. With the upward move on the day, the
Small Cap
0.5
62
13,652
major averages once again reached new record closing highs.
Bankex
1.0
228
23,751
The majority of the European markets ended Tuesday's session solidly in positive
territory. However, the FTSE 100 of the UK was one notable exception. The UK
market struggled due to mixed corporate earnings and concerns over the upcoming
Global Indices
Chg (%)
(Pts)
(Close)
French Presidential election.
Dow Jones
0.6
119
20,743
Nasdaq
0.5
27
5,866
Indian market hit their highest level since September on Tuesday even as global
FTSE
(0.3)
(25)
7,275
sentiment remained nervous amid French election worries, the lack of clarity on the
Nikkei
0.7
130
19,381
policies of the new U.S. administration and uncertainty over the timing of Federal
Reserve's next rate hike.
Hang Seng
(0.8)
(182)
23,964
Shanghai Com
0.4
13
3,253
News Analysis
Alkem Labs - Accumulate with price target `2,127
Advances / Declines
BSE
NSE
Detailed analysis on Pg2
Advances
1,558
923
Investor’s Ready Reckoner
Declines
1,283
700
Key Domestic & Global Indicators
Unchanged
185
84
Stock Watch: Latest investment recommendations on 150+ stocks
Refer Pg5 onwards
Volumes (` Cr)
BSE
3,018
Top Picks
CMP
Target
Upside
NSE
22,346
Company
Sector
Rating
(`)
(`)
(%)
Amara Raja Batteries Auto & Auto Ancillary
Buy
860
1,009
17.4
Net Inflows (` Cr)
Net
Mtd
Ytd
HCL Tech
IT
Buy
852
1,000
17.3
Power Grid Corp.
Power
Accumulate
206
223
8.4
FII
8,059
10,610
10,564
Navkar Corp.
Others
Buy
166
265
59.4
MFs
499
1,446
6,661
KEI Industries
Others
Buy
177
207
17.2
More Top Picks on Pg3
Top Gainers
Price (`)
Chg (%)
Key Upcoming Events
Raymond
570
13.4
Previous
Consensus
Date
Region
Event Description
Jindalstel
109
9.2
Reading
Expectations
Monsanto
2,496
7.7
Feb 22 US
Existing home sales
5.49
5.54
Feb 22 Euro Zone Euro-Zone CPI (YoY)
1.80
1.80
Jetairways
411
7.4
Feb 22 UK
GDP (YoY)
2.20
2.20
Indiacem
172
5.8
Feb 23 US
New home sales
536.00
571.00
Feb 23 US
Initial Jobless claims
239.00
240.00
Top Losers
Price (`)
Chg (%)
More Events on Pg4
Jpassociat
14
(4.3)
Infratel
296
(4.3)
Mfsl
569
(4.2)
Bhartiartl
363
(3.4)
Gmrinfra
15
(3.0)
As on February 21, 2017
Market Outlook
February 22, 2017
News Analysis
Alkem Labs - Accumulate with price target `2,127
Alkem has continued to outperform the industry growth owing to its strong
capabilities in acute segment which contributes ~82% of its domestic business.
Despite being late entrant in the chronic segment, company has continued to beat
the competition by reporting better growth than the industry. During the 9MFY17
period, company reported faster growth in its Neuro/CNS, Cardiac and Anti-
diabetic segments vs. industry, indicating that the company is on its way to
replicate the strong performance in acute segment in the chronic segment.
Alkem has filed 77 ANDAs by 3QFY17 of which 35 ANDAs are approved by
USFDA. Its total pipeline contains 33 Para IVs and FTFs. Over FY12-9MFY17, its
pipeline has increased 2.5x as company has increased its focus on the US market.
Company has indicated of ~10-11 ANDA fillings in 4QFY17E and expects to file
~12-14 ANDAs in FY18E. Between FY14-FY16, Alkem’s US revenues grew at 44%
CAGR, which has increased its base. We believe that, with the higher monetization
of its pipeline, Alkem can keep growing at sub 30% growth rate. In our opinion,
company is likely to cross `2,000cr mark by FY19E. With the improving RoE profile
and strong growth expectations, we value stock at 20x of FY19E and raise the
stock price to `2,127. We maintain the ‘Accumulate’ rating.
Y/E
Sales OPM PAT
EPS ROE P/E P/BV EV/EBITDA EV/Sales
March
(` cr)
(%)
(` Cr)
(` cr)
(%)
(x)
(x)
(x)
(x)
FY2018E
7,009
19.8
1,088
91.0
21.4
22.1
4.7
17.1
3.4
FY2019E
8,252
19.8
1,271
106.3
21.3
18.9
4.0
14.5
2.9
Economic and Political News
Electronics industry estimated to grow at a CAGR of up to 23%
Iron ore production in Odisha has touched a peak of 85 mt
India wants certainty, transparency in US visa regime: Nirmala Sitharaman
Corporate News
Piramal eyes 3rd spot in domestic OTC market by 2019
Dish TV partners with ICICI Bank for digital payments
Indian electronics' market to be $228 bn in 2020: ESDM
India Ratings maintains negative outlook on infra sector in FY-18
Market Outlook
February 22, 2017
Top Picks ★★★★★
Large Cap
Market Cap
CMP
Target
Upside
Company
Rationale
(` Cr)
(`)
(`)
(%)
To outpace battery industry growth due to better
Amara Raja Batteries
14,685
860
1,009
17.4
technological products leading to market share gains in both
the automotive OEM and replacement segments.
The stock is trading at attractive valuations and is factoring
HCL Tech
1,20,276
852
1,000
17.3
all the bad news.
Back on the growth trend, expect a long term growth of 14%
Infosys
2,32,669
1,013
1,249
23.3
to be a US$20bn in FY2020.
Strong order backlog and improvement in execution would
Larsen & Toubro
1,38,354
1,483
1,634
10.2
trigger the growth for the L&T
One of the largest pharma companies with strong
Lupin
66,329
1,469
1,809
23.1
international presence. It has a rich pipeline of ANDAs which
is also one of the largest among the generic companies.
Going forward, we expect the company to report strong
Power Grid Corporation
1,07,666
206
223
8.4
top-line CAGR of ~16% and bottom-line CAGR of ~19%
over FY16-18 on back of strong capitalization guidance
Source: Company, Angel Research
Mid Cap
Market Cap
CMP
Target
Upside
Company
Rationale
(` Cr)
(`)
(`)
(%)
We expect the company would report strong profitability
Asian Granito
850
282
351
24.3
owing to better product mix, higher B2C sales and
amalgamation synergy.
Among the top 4 players in the consumer durables segment.
Bajaj Electricals
2,608
258
295
14.5
Improved profitability backed by turn around in E&P segment.
Strong order book lends earnings visibility.
Favourable outlook for the AC industry to augur well for
Cooling products business which is out pacing the market
Blue Star
5,303
555
634
14.2
growth. EMPPAC division's profitability to improve once
operating environment turns around.
With a focus on the low and medium income (LMI) consumer
Dewan Housing Finance
10,095
322
350
8.6
segment, the company has increased its presence in tier-II &
III cities where the growth opportunity is immense.
Strong loan growth backed by diversified loan portfolio and
Equitas Holdings
6,148
182
235
29.0
adequate CAR. ROE & ROA likely to remain decent as risk of
dilution remains low. Attractive valuations considering growth.
Economic recovery to have favourable impact on advertising
& circulation revenue growth. Further, the acquisition of a
Jagran Prakashan
6,208
190
225
18.5
radio business (Radio City) would also boost the company's
revenue growth.
High order book execution in EPC segment, rising B2C sales
KEI Industries
1,374
177
207
17.2
and higher exports to boost the revenues and profitability
Speedier execution and speedier sales, strong revenue visibilty
Mahindra Lifespace
1,433
349
522
49.5
in short-to-long run, attractive valuations
Higher growth in domestic branded sales and healthy export
Mirza International
1,121
93
107
14.8
to boost the profitability.
Massive capacity expansion along with rail advantage at ICD
Navkar Corporation
2,371
166
265
59.4
as well CFS augurs well for the company
Market leadership in Hindi news genre and no. 2 viewership
ranking in English news genre, exit from the radio business,
TV Today Network
1,578
265
385
45.6
and anticipated growth in ad spends by corporates to benefit
the stock.
Source: Company, Angel Research
Market Outlook
February 22, 2017
Key Upcoming Events
Global economic events release calendar
Bloomberg Data
Date
Time
Country
Event Description
Unit
Period
Last Reported
Estimated
Feb 22, 2017
8:30 PM US
Existing home sales
Million
Jan
5.49
5.54
3:30 PM Euro Zone Euro-Zone CPI (YoY)
%
Jan F
1.80
1.80
3:00 PM UK
GDP (YoY)
% Change 4Q P
2.20
2.20
Feb 23, 2017
8:30 PM US
New home sales
Thousands
Jan
536.00
571.00
7:00 PM US
Initial Jobless claims
Thousands Feb 18
239.00
240.00
Feb 24, 2017
12:30 PM Germany GDP nsa (YoY)
% Change 4Q F
1.20
1.20
Feb 27, 2017
3:30 PM Euro Zone Euro-Zone Consumer Confidence
Value
Feb F
-6.20
Feb 28, 2017
8:30 PM US
Consumer Confidence
S.A./ 1985=100 Feb
111.80
111.50
7:00 PM US
GDP Qoq (Annualised)
% Change 4Q S
1.90
2.00
Mar 01, 2017
2:25 PM Germany Unemployment change (000's)
Thousands
Feb
-26.00
3:00 PM UK
PMI Manufacturing
Value
Feb
55.90
6:30 AM China
PMI Manufacturing
Value
Feb
51.30
51.20
Mar 07, 2017
3:30 PM Euro Zone Euro-Zone GDP s.a. (QoQ)
% Change 4Q F
0.40
Mar 08, 2017
China
Exports YoY%
% Change
Feb
7.90
March 09, 2017 7:00 AM China
Consumer Price Index (YoY)
% Change
Feb
2.50
India
Imports YoY%
% Change
Feb
10.70
March 10, 2017 6:15 PM Euro Zone ECB announces interest rates
%
Mar 9
0.00
India
Exports YoY%
% Change
Feb
4.30
3:00 PM UK
Industrial Production (YoY)
% Change
Jan
4.30
Source: Bloomberg, Angel Research
Market Outlook
February 22, 2017
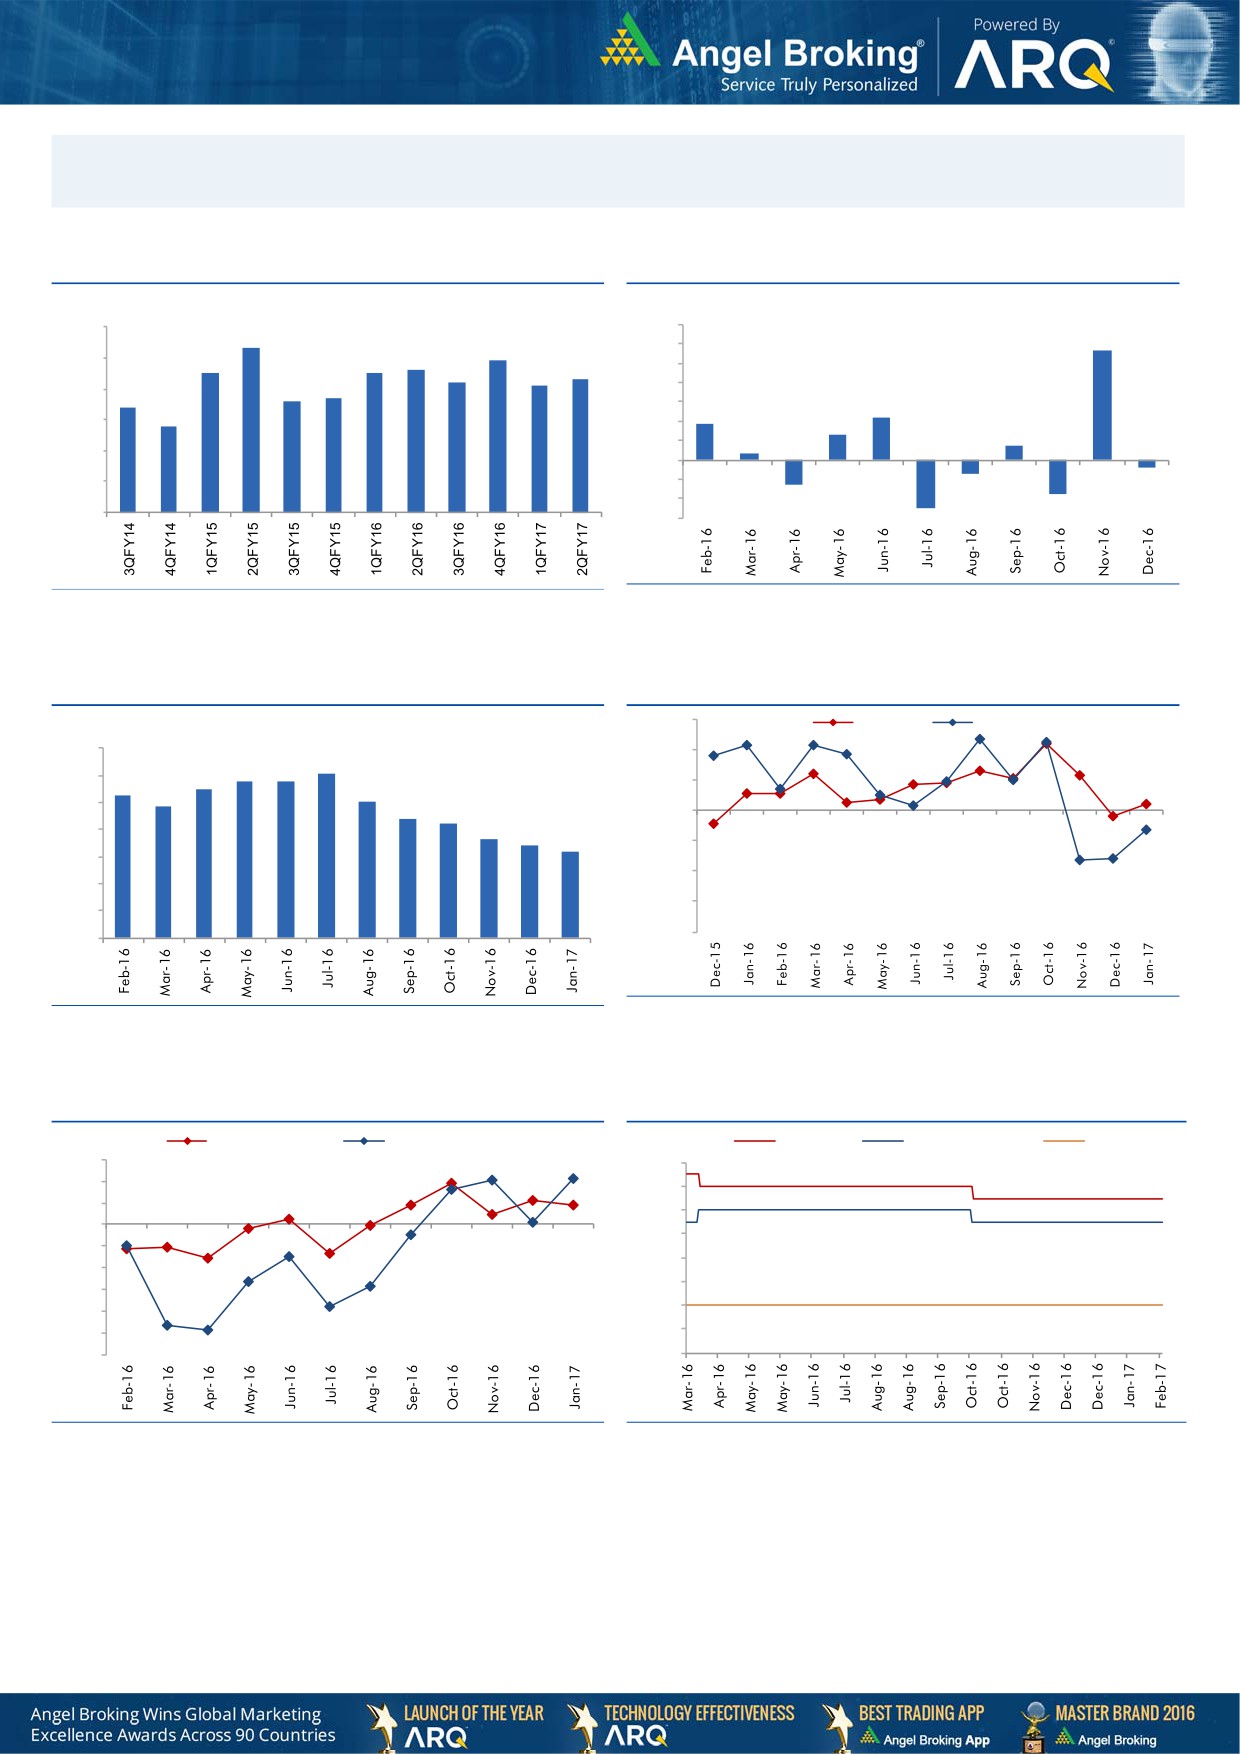
Macro watch
Exhibit 1: Quarterly GDP trends
Exhibit 2: IIP trends
(%)
(%)
9.0
7.0
8.3
5.7
7.9
6.0
8.0
7.5
7.5
7.6
7.3
5.0
7.2
7.1
6.6
6.7
4.0
7.0
6.4
3.0
2.2
5.8
1.9
6.0
2.0
1.3
0.7
1.0
0.3
5.0
-
4.0
(1.0)
(0.7)
(0.4)
(2.0)
(1.3)
3.0
(1.8)
(3.0)
(2.5)
Source: MOSPI, Angel Research
Source: CSO, Angel Research
Exhibit 3: Monthly CPI inflation trends
Exhibit 4: Manufacturing and services PMI
56.0
Mfg. PMI
Services PMI
(%)
7.0
54.0
6.1
5.8
5.8
6.0
5.5
5.3
5.1
52.0
4.8
5.0
4.4
4.2
50.0
3.6
4.0
3.4
3.2
48.0
3.0
46.0
2.0
44.0
1.0
42.0
-
Source: Market, Angel Research; Note: Level above 50 indicates expansion
Source: MOSPI, Angel Research
Exhibit 5: Exports and imports growth trends
Exhibit 6: Key policy rates
(%)
Exports yoy growth
Imports yoy growth
(%)
Repo rate
Reverse Repo rate
CRR
15.0
7.00
10.0
6.50
5.0
6.00
0.0
5.50
(5.0)
5.00
(10.0)
4.50
(15.0)
4.00
(20.0)
(25.0)
3.50
(30.0)
3.00
Source: Bloomberg, Angel Research
Source: RBI, Angel Research
Market Outlook
February 22, 2017
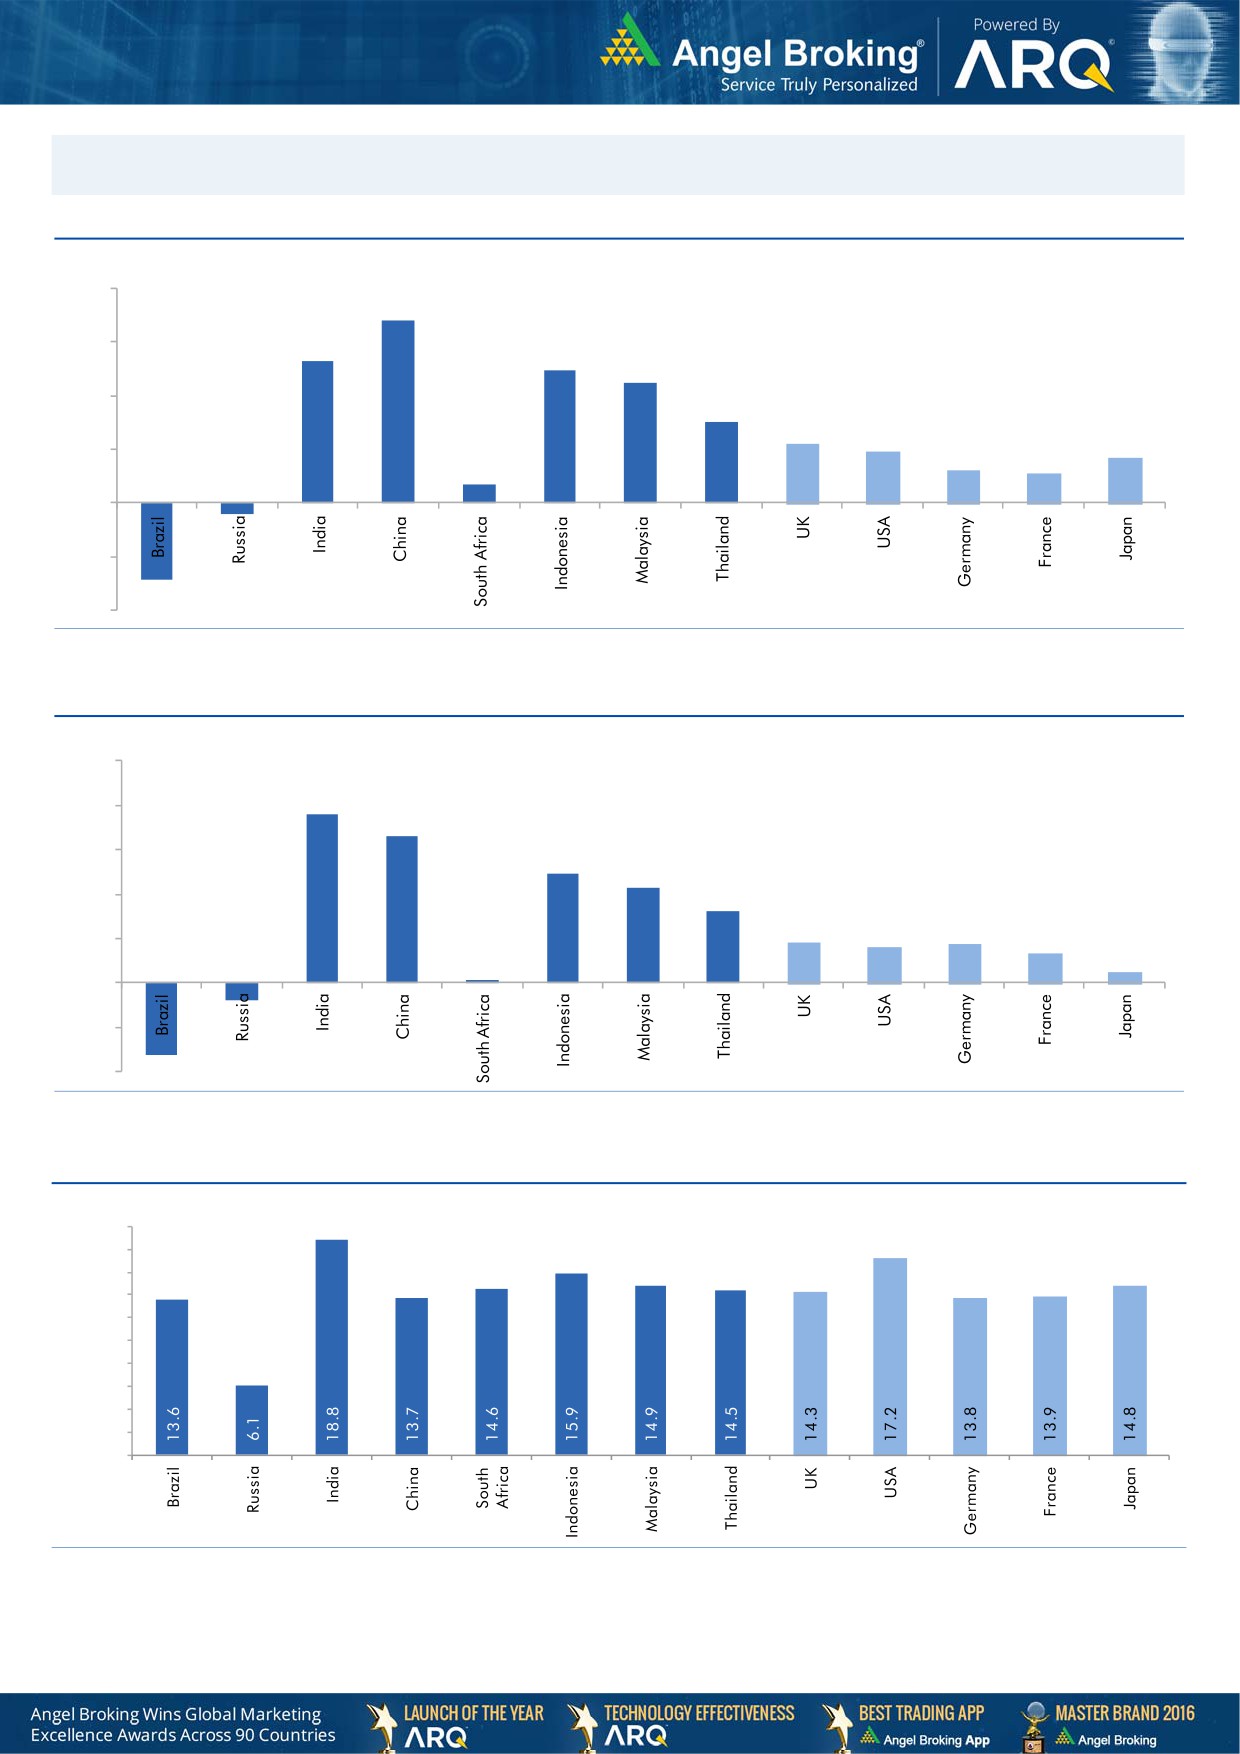
Global watch
Exhibit 1: Latest quarterly GDP Growth (%, yoy) across select developing and developed countries
(%)
8.0
6.8
5.3
6.0
4.9
0.7
4.5
4.0
3.0
2.2
1.9
1.7
2.0
1.2
1.1
-
(2.0)
(0.4)
(2.9)
(4.0)
Source: Bloomberg, Angel Research
Exhibit 2: 2016 GDP Growth projection by IMF (%, yoy) across select developing and developed countries
(%)
10.0
7.6
8.0
6.6
6.0
4.9
4.3
4.0
3.2
1.8
1.6
1.7
2.0
1.3
(0.8)
0.5
(3.3)
0.1
-
(2.0)
(4.0)
Source: IMF, Angel Research
Exhibit 3: One year forward P-E ratio across select developing and developed countries
(x)
20.0
18.0
16.0
14.0
12.0
10.0
8.0
6.0
4.0
2.0
-
Source: IMF, Angel Research
Market Outlook
February 22, 2017
Exhibit 4: Relative performance of indices across globe
Returns (%)
Country
Name of index
Closing price
1M
3M
1YR
Brazil
Bovespa
69,052
8.0
13.1
62.4
Russia
Micex
2,128
(1.5)
3.0
18.0
India
Nifty
8,908
5.6
11.3
26.4
China
Shanghai Composite
3,253
4.8
1.5
17.7
South Africa
Top 40
45,556
(0.5)
3.1
2.5
Mexico
Mexbol
47,615
2.9
7.3
10.3
Indonesia
LQ45
886
1.6
2.5
7.0
Malaysia
KLCI
1,707
2.6
4.7
2.5
Thailand
SET 50
981
1.2
6.9
19.4
USA
Dow Jones
20,743
5.1
9.9
26.2
UK
FTSE
7,275
1.1
7.4
24.0
Japan
Nikkei
19,381
1.3
8.5
29.6
Germany
DAX
11,967
2.9
11.7
26.0
France
CAC
4,889
0.8
7.5
10.5
Source: Bloomberg, Angel Research
Stock Watch
February 22, 2017
Company Name
Reco
CMP
Target
Mkt Cap
Sales ( Čcr )
OPM(%)
EPS (Č)
PER(x)
P/BV(x)
RoE(%)
EV/Sales(x)
(Č)
Price ( Č)
( Č cr )
FY17E FY18E
FY17E
FY18E
FY17E
FY18E
FY17E
FY18E
FY17E
FY18E
FY17E
FY18E
FY17E
FY18E
Agri / Agri Chemical
Rallis
Neutral
242
-
4,704
1,937
2,164
13.3
14.3
9.0
11.0
26.9
22.0
4.7
4.1
18.4
19.8
2.5
2.2
United Phosphorus
Neutral
711
-
36,059
15,176
17,604
18.5
18.5
37.4
44.6
19.0
16.0
3.7
3.1
21.4
21.2
2.5
2.1
Auto & Auto Ancillary
Ashok Leyland
Buy
95
111
27,093
20,021
21,915
11.6
11.9
4.5
5.3
21.2
17.9
4.3
3.8
20.6
21.5
1.3
1.2
Bajaj Auto
Neutral
2,806
-
81,199
25,093
27,891
19.5
19.2
143.9
162.5
19.5
17.3
5.5
4.7
30.3
29.4
3.0
2.6
Bharat Forge
Neutral
1,080
-
25,151
7,726
8,713
20.5
21.2
35.3
42.7
30.6
25.3
5.7
5.1
18.9
20.1
3.3
2.9
Eicher Motors
Neutral
25,254
-
68,715
16,583
20,447
17.5
18.0
598.0
745.2
42.2
33.9
14.4
11.0
41.2
38.3
4.0
3.2
Gabriel India
Accumulate
116
130
1,668
1,544
1,715
9.0
9.3
5.4
6.3
21.5
18.4
4.1
3.6
18.9
19.5
1.0
0.9
Hero Motocorp
Accumulate
3,129
3,446
62,475
28,083
30,096
15.3
15.7
171.8
187.0
18.2
16.7
6.4
5.3
30.1
27.9
2.1
1.9
Jamna Auto Industries Neutral
203
-
1,620
1,486
1,620
9.8
9.9
15.0
17.2
13.6
11.8
3.0
2.5
21.8
21.3
1.2
1.0
L G Balakrishnan & Bros Neutral
565
-
887
1,302
1,432
11.6
11.9
43.7
53.0
12.9
10.7
1.8
1.7
13.8
14.2
0.8
0.7
Mahindra and Mahindra Neutral
1,315
-
81,667
46,534
53,077
11.6
11.7
67.3
78.1
19.5
16.9
3.2
2.8
15.4
15.8
1.7
1.5
Maruti
Accumulate
6,063
6,560
183,142
67,822
83,288
16.0
16.4
253.8
312.4
23.9
19.4
5.5
4.4
23.0
22.9
2.4
1.9
Minda Industries
Neutral
379
-
3,010
2,728
3,042
9.0
9.1
68.2
86.2
5.6
4.4
1.3
1.0
23.8
24.3
1.2
1.0
Motherson Sumi
Neutral
350
-
49,182
45,896
53,687
7.8
8.3
13.0
16.1
26.9
21.8
8.7
6.9
34.7
35.4
1.1
1.0
Rane Brake Lining
Neutral
973
-
770
511
562
11.3
11.5
28.1
30.9
34.6
31.5
5.3
4.8
15.3
15.0
1.6
1.5
Setco Automotive
Neutral
36
-
474
741
837
13.0
13.0
15.2
17.0
2.3
2.1
0.4
0.4
15.8
16.3
1.0
0.9
Tata Motors
Neutral
459
-
132,515
300,209
338,549
8.9
8.4
42.7
54.3
10.8
8.5
1.7
1.5
15.6
17.2
0.6
0.5
TVS Motor
Neutral
429
-
20,381
13,390
15,948
6.9
7.1
12.8
16.5
33.6
25.9
8.4
6.6
26.3
27.2
1.6
1.3
Amara Raja Batteries
Buy
860
1,009
14,685
5,305
6,100
16.0
16.3
28.4
34.0
30.3
25.3
5.8
4.9
19.3
19.3
2.8
2.4
Exide Industries
Neutral
215
-
18,279
7,439
8,307
15.0
15.0
8.1
9.3
26.6
23.1
3.7
3.3
14.3
16.7
2.1
1.9
Apollo Tyres
Buy
180
235
9,157
12,877
14,504
14.3
13.9
21.4
23.0
8.4
7.8
1.3
1.1
16.4
15.2
0.9
0.8
Ceat
Buy
1,117
1,450
4,516
7,524
8,624
13.0
12.7
131.1
144.3
8.5
7.7
1.6
1.3
19.8
18.6
0.7
0.6
JK Tyres
Neutral
118
-
2,678
7,455
8,056
15.0
15.0
21.8
24.5
5.4
4.8
1.1
0.9
22.8
21.3
0.5
0.4
Swaraj Engines
Neutral
1,379
-
1,713
660
810
15.2
16.4
54.5
72.8
25.3
18.9
7.9
7.2
31.5
39.2
2.4
1.9
Subros
Neutral
203
-
1,220
1,488
1,681
11.7
11.9
6.4
7.2
31.8
28.4
3.4
3.0
10.8
11.4
1.1
0.9
Indag Rubber
Neutral
174
-
457
286
326
19.8
16.8
11.7
13.3
14.9
13.1
2.5
2.4
17.8
17.1
1.3
1.1
Capital Goods
ACE
Neutral
51
-
504
709
814
4.1
4.6
1.4
2.1
36.4
24.2
1.5
1.4
4.4
6.0
0.9
0.8
BEML
Neutral
1,314
-
5,472
3,451
4,055
6.3
9.2
31.4
57.9
41.9
22.7
2.5
2.3
6.3
10.9
1.7
1.4
Bharat Electronics
Neutral
1,560
-
34,847
8,137
9,169
16.8
17.2
58.7
62.5
26.6
25.0
4.1
3.7
44.6
46.3
3.3
2.9
Stock Watch
February 22, 2017
Company Name
Reco
CMP
Target
Mkt Cap
Sales ( Čcr )
OPM(%)
EPS (Č)
PER(x)
P/BV(x)
RoE(%)
EV/Sales(x)
(Č)
Price ( Č)
( Č cr )
FY17E
FY18E
FY17E
FY18E
FY17E
FY18E
FY17E
FY18E
FY17E
FY18E
FY17E
FY18E
FY17E
FY18E
Capital Goods
Voltas
Accumulate
363
407
11,995
6,511
7,514
7.9
8.7
12.9
16.3
28.1
22.2
5.1
4.4
16.7
18.5
1.6
1.4
BGR Energy
Neutral
141
-
1,016
16,567
33,848
6.0
5.6
7.8
5.9
18.1
23.9
1.0
1.0
4.7
4.2
0.2
0.1
BHEL
Neutral
155
-
37,828
28,797
34,742
-
2.8
2.3
6.9
67.2
22.4
1.1
1.1
1.3
4.8
1.0
0.7
Blue Star
Accumulate
555
634
5,303
4,283
5,077
5.9
7.3
14.9
22.1
37.3
25.1
7.2
6.1
20.4
26.4
1.3
1.1
Crompton Greaves
Neutral
68
-
4,249
5,777
6,120
5.9
7.0
3.3
4.5
20.6
15.1
0.9
0.9
4.4
5.9
0.7
0.6
Greaves Cotton
Neutral
161
-
3,931
1,755
1,881
16.8
16.9
7.8
8.5
20.6
18.9
4.1
3.8
20.6
20.9
1.9
1.8
Inox Wind
Neutral
178
-
3,956
5,605
6,267
15.7
16.4
24.8
30.0
7.2
5.9
2.0
1.5
25.9
24.4
0.7
0.6
KEC International
Neutral
170
-
4,359
9,294
10,186
7.9
8.1
9.9
11.9
17.1
14.3
2.5
2.2
15.6
16.3
0.7
0.6
KEI Industries
Buy
177
207
1,374
2,682
3,058
10.4
10.0
11.7
12.8
15.1
13.8
3.0
2.5
20.1
18.2
0.7
0.6
Thermax
Neutral
857
-
10,211
5,421
5,940
7.3
7.3
25.7
30.2
33.3
28.4
4.0
3.7
12.2
13.1
1.8
1.6
VATech Wabag
Buy
525
681
2,863
3,136
3,845
8.9
9.1
26.0
35.9
20.2
14.6
2.5
2.2
13.4
15.9
0.8
0.6
Cement
ACC
Neutral
1,466
-
27,536
11,225
13,172
13.2
16.9
44.5
75.5
33.0
19.4
3.1
2.9
11.2
14.2
2.5
2.1
Ambuja Cements
Neutral
239
-
47,397
9,350
10,979
18.2
22.5
5.8
9.5
41.2
25.1
3.5
3.1
10.2
12.5
5.1
4.3
India Cements
Neutral
172
-
5,290
4,364
4,997
18.5
19.2
7.9
11.3
21.8
15.2
1.6
1.5
8.0
8.5
2.0
1.7
JK Cement
Neutral
891
-
6,231
4,398
5,173
15.5
17.5
31.2
55.5
28.6
16.1
3.4
3.0
12.0
15.5
2.0
1.6
J K Lakshmi Cement
Neutral
395
-
4,643
2,913
3,412
14.5
19.5
7.5
22.5
52.6
17.5
3.2
2.7
12.5
18.0
2.2
1.8
Orient Cement
Neutral
133
-
2,716
2,114
2,558
18.5
20.5
8.1
11.3
16.4
11.7
2.4
2.0
9.0
14.0
1.9
1.5
UltraTech Cement
Neutral
3,769
-
103,460
25,768
30,385
21.0
23.5
111.0
160.0
34.0
23.6
4.3
3.8
13.5
15.8
4.1
3.4
Construction
ITNL
Neutral
103
-
3,378
8,946
10,017
31.0
31.6
8.1
9.1
12.7
11.3
0.5
0.5
4.2
5.0
3.7
3.4
KNR Constructions
Neutral
179
-
2,519
1,385
1,673
14.7
14.0
41.2
48.5
4.4
3.7
0.8
0.7
14.9
15.2
1.9
1.6
Larsen & Toubro
Accumulate
1,483
1,634
138,354
111,017
124,908
11.0
11.0
61.1
66.7
24.3
22.2
2.9
2.7
13.1
12.9
2.3
2.1
Gujarat Pipavav Port
Neutral
163
-
7,873
705
788
52.2
51.7
5.0
5.6
32.6
29.1
3.2
2.9
11.2
11.2
10.8
9.2
Nagarjuna Const.
Neutral
84
-
4,659
8,842
9,775
9.1
8.8
5.3
6.4
15.8
13.1
1.3
1.2
8.2
9.1
0.7
0.6
PNC Infratech
Buy
102
143
2,617
2,350
2,904
13.1
13.2
9.0
8.8
11.3
11.6
0.4
0.4
15.9
13.9
1.2
1.0
Simplex Infra
Neutral
310
-
1,534
6,829
7,954
10.5
10.5
31.4
37.4
9.9
8.3
1.0
0.9
9.9
13.4
0.7
0.6
Power Mech Projects
Neutral
444
-
653
1,801
2,219
12.7
14.6
72.1
113.9
6.2
3.9
1.1
1.0
16.8
11.9
0.4
0.3
Sadbhav Engineering
Accumulate
279
298
4,787
3,598
4,140
10.3
10.6
9.0
11.9
31.0
23.5
3.2
2.9
9.9
11.9
1.6
1.4
NBCC
Neutral
176
-
15,845
7,428
9,549
7.9
8.6
8.2
11.0
21.5
16.0
1.1
0.8
28.2
28.7
1.8
1.4
MEP Infra
Neutral
43
-
699
1,877
1,943
30.6
29.8
3.0
4.2
14.3
10.2
6.9
4.7
0.6
0.6
1.8
1.6
Stock Watch
February 22, 2017
Company Name
Reco
CMP
Target
Mkt Cap
Sales ( Čcr )
OPM(%)
EPS (Č)
PER(x)
P/BV(x)
RoE(%)
EV/Sales(x)
(Č)
Price ( Č)
( Č cr )
FY17E
FY18E
FY17E
FY18E
FY17E
FY18E
FY17E
FY18E
FY17E
FY18E
FY17E
FY18E
FY17E
FY18E
Construction
SIPL
Neutral
94
-
3,314
1,036
1,252
65.5
66.2
(8.4)
(5.6)
3.5
4.0
(22.8)
(15.9)
11.4
9.5
Engineers India
Neutral
153
-
10,324
1,725
1,935
16.0
19.1
11.4
13.9
13.4
11.0
1.9
1.8
13.4
15.3
4.9
4.4
Financials
Axis Bank
Accumulate
505
580
120,709
46,932
53,575
3.5
3.4
32.4
44.6
15.6
11.3
2.0
1.7
13.6
16.5
-
-
Bank of Baroda
Neutral
169
-
38,963
19,980
23,178
1.8
1.8
11.5
17.3
14.7
9.8
1.7
1.4
8.3
10.1
-
-
Canara Bank
Neutral
294
-
15,950
15,225
16,836
1.8
1.8
14.5
28.0
20.3
10.5
1.4
1.1
5.8
8.5
-
-
Can Fin Homes
Accumulate
1,988
2,128
5,293
420
526
3.5
3.5
86.5
107.8
23.0
18.5
5.0
4.1
23.6
24.1
-
-
Cholamandalam Inv. &
Buy
1,023
1,230
15,981
2,012
2,317
6.3
6.3
42.7
53.6
24.0
19.1
3.8
3.3
16.9
18.3
-
-
Fin. Co.
Dewan Housing Finance Accumulate
322
350
10,095
2,225
2,688
2.9
2.9
29.7
34.6
10.9
9.3
1.8
1.5
16.1
16.8
-
-
Equitas Holdings
Buy
182
235
6,148
939
1,281
11.7
11.5
5.8
8.2
31.4
22.2
2.7
2.4
10.9
11.5
-
-
Federal Bank
Neutral
86
-
14,830
8,259
8,995
3.0
3.0
4.3
5.6
20.0
15.4
1.7
1.6
8.5
10.1
-
-
HDFC
Neutral
1,412
-
223,926
11,475
13,450
3.4
3.4
45.3
52.5
31.2
26.9
6.0
5.3
20.2
20.5
-
-
HDFC Bank
Neutral
1,412
-
361,306
46,097
55,433
4.5
4.5
58.4
68.0
24.2
20.8
4.2
3.5
18.8
18.6
-
-
ICICI Bank
Accumulate
285
315
165,864
42,800
44,686
3.1
3.3
18.0
21.9
15.8
13.0
2.1
2.0
11.1
12.3
-
-
Lakshmi Vilas Bank
Accumulate
154
174
2,952
3,339
3,799
2.7
2.8
11.0
14.0
14.0
11.0
1.5
1.3
11.2
12.7
-
-
LIC Housing Finance
Accumulate
558
630
28,148
3,712
4,293
2.6
2.5
39.0
46.0
14.3
12.1
2.7
2.3
19.9
20.1
-
-
Punjab Natl.Bank
Neutral
144
-
30,590
23,532
23,595
2.3
2.4
6.8
12.6
21.1
11.4
3.3
2.3
3.3
6.5
-
-
RBL Bank
Neutral
427
-
15,774
1,783
2,309
2.6
2.6
12.7
16.4
33.6
26.0
3.7
3.3
12.8
13.3
-
-
South Ind.Bank
Neutral
21
-
2,812
6,435
7,578
2.5
2.5
2.7
3.1
7.7
6.7
1.0
0.8
10.1
11.2
-
-
St Bk of India
Neutral
271
-
215,803
88,650
98,335
2.6
2.6
13.5
18.8
20.1
14.4
1.9
1.7
7.0
8.5
-
-
Union Bank
Neutral
145
-
9,971
13,450
14,925
2.3
2.3
25.5
34.5
5.7
4.2
0.8
0.7
7.5
10.2
-
-
Yes Bank
Neutral
1,450
-
61,383
8,978
11,281
3.3
3.4
74.0
90.0
19.6
16.1
3.7
3.2
17.0
17.2
-
-
FMCG
Asian Paints
Neutral
991
-
95,071
17,128
18,978
16.8
16.4
19.1
20.7
51.9
47.9
18.1
17.0
34.8
35.5
5.5
4.9
Britannia
Accumulate
3,236
3,626
38,834
9,594
11,011
14.6
14.9
80.3
94.0
40.3
34.4
16.6
12.8
41.2
-
3.9
3.4
Colgate
Accumulate
914
995
24,849
4,605
5,149
23.4
23.4
23.8
26.9
38.4
34.0
21.3
16.6
64.8
66.8
5.3
4.7
Dabur India
Accumulate
273
304
48,019
8,315
9,405
19.8
20.7
8.1
9.2
33.7
29.6
9.4
7.8
31.6
31.0
5.4
4.8
GlaxoSmith Con*
Neutral
5,228
-
21,986
4,350
4,823
21.2
21.4
179.2
196.5
29.2
26.6
7.8
6.6
27.1
26.8
4.4
3.9
Godrej Consumer
Neutral
1,702
-
57,965
10,235
11,428
18.4
18.6
41.1
44.2
41.4
38.5
9.2
7.8
24.9
24.8
5.7
5.1
HUL
Neutral
863
-
186,734
35,252
38,495
17.8
17.8
20.7
22.4
41.8
38.5
39.9
34.3
95.6
88.9
5.1
4.7
ITC
Accumulate
263
284
319,455
40,059
44,439
38.3
39.2
9.0
10.1
29.3
26.0
8.2
7.1
27.8
27.5
7.5
6.7
Stock Watch
February 22, 2017
Company Name
Reco
CMP
Target
Mkt Cap
Sales ( Čcr )
OPM(%)
EPS (Č)
PER(x)
P/BV(x)
RoE(%)
EV/Sales(x)
(Č)
Price ( Č)
( Č cr )
FY17E FY18E
FY17E
FY18E
FY17E
FY18E
FY17E
FY18E
FY17E
FY18E
FY17E
FY18E
FY17E
FY18E
FMCG
Marico
Accumulate
275
300
35,440
6,430
7,349
18.8
19.5
6.4
7.7
42.9
35.7
13.0
10.9
33.2
32.5
5.3
4.6
Nestle*
Neutral
6,354
-
61,264
10,073
11,807
20.7
21.5
124.8
154.2
50.9
41.2
20.9
18.8
34.8
36.7
5.9
5.0
Tata Global
Neutral
142
-
8,937
8,675
9,088
9.8
9.8
7.4
8.2
19.1
17.3
2.2
2.1
7.9
8.1
0.9
0.9
Procter & Gamble
Accumulate
7,001
7,369
22,726
2,939
3,342
23.2
23.0
146.2
163.7
47.9
42.8
107.2
102.8
25.3
23.5
7.3
6.3
Hygiene
IT
HCL Tech^
Buy
852
1,000
120,276
49,242
57,168
20.5
20.5
55.7
64.1
15.3
13.3
3.1
2.4
20.3
17.9
2.3
1.9
Infosys
Buy
1,013
1,249
232,669
68,350
77,326
27.0
27.0
62.5
69.4
16.2
14.6
3.5
3.2
21.3
21.6
2.8
2.5
TCS
Accumulate
2,464
2,700
485,573
119,025
133,308
27.6
27.6
131.2
145.5
18.8
16.9
6.1
5.6
32.4
33.1
3.9
3.4
Tech Mahindra
Buy
508
600
49,408
29,673
32,937
15.5
17.0
32.8
39.9
15.5
12.7
3.0
2.6
19.6
20.7
1.4
1.2
Wipro
Buy
476
583
115,601
55,440
60,430
18.1
18.1
36.1
38.9
13.2
12.2
2.4
2.2
19.0
17.6
1.8
1.6
Media
D B Corp
Neutral
380
-
6,983
2,297
2,590
27.4
28.2
21.0
23.4
18.1
16.2
4.2
3.7
23.7
23.1
2.8
2.4
HT Media
Neutral
85
-
1,983
2,693
2,991
12.6
12.9
7.9
9.0
10.8
9.5
0.9
0.8
7.8
8.3
0.3
0.2
Jagran Prakashan
Buy
190
225
6,208
2,355
2,635
28.0
28.0
10.8
12.5
17.6
15.2
3.8
3.3
21.7
21.7
2.7
2.3
Sun TV Network
Neutral
703
-
27,722
2,850
3,265
70.1
71.0
26.2
30.4
26.9
23.1
6.9
6.1
24.3
25.6
9.3
8.0
Hindustan Media
Neutral
267
-
1,959
1,016
1,138
24.3
25.2
27.3
30.1
9.8
8.9
1.9
1.7
16.2
15.8
1.3
1.1
Ventures
TV Today Network
Buy
265
385
1,578
637
743
27.5
27.5
18.4
21.4
14.4
12.4
2.5
2.1
17.4
17.2
2.1
1.7
Metals & Mining
Coal India
Neutral
320
-
198,389
84,638
94,297
21.4
22.3
24.5
27.1
13.0
11.8
5.4
5.2
42.6
46.0
1.9
1.7
Hind. Zinc
Neutral
303
-
128,217
14,252
18,465
55.9
48.3
15.8
21.5
19.2
14.1
3.1
2.7
17.0
20.7
9.0
6.9
Hindalco
Neutral
182
-
37,681
107,899
112,095
7.4
8.2
9.2
13.0
19.8
14.0
1.0
0.9
4.8
6.6
0.9
0.8
JSW Steel
Neutral
187
-
45,238
53,201
58,779
16.1
16.2
130.6
153.7
1.4
1.2
0.2
0.2
14.0
14.4
1.6
1.4
NMDC
Neutral
143
-
45,259
6,643
7,284
44.4
47.7
7.1
7.7
20.2
18.6
1.8
1.7
8.8
9.2
4.6
4.1
SAIL
Neutral
62
-
25,751
47,528
53,738
(0.7)
2.1
(1.9)
2.6
24.0
0.7
0.7
(1.6)
3.9
1.4
1.3
Vedanta
Neutral
269
-
79,706
71,744
81,944
19.2
21.7
13.4
20.1
20.1
13.4
1.7
1.5
8.4
11.3
1.5
1.2
Tata Steel
Neutral
491
-
47,648
121,374
121,856
7.2
8.4
18.6
34.3
26.4
14.3
1.6
1.5
6.1
10.1
1.0
1.0
Oil & Gas
Cairn India
Neutral
293
-
54,936
9,127
10,632
4.3
20.6
8.8
11.7
33.3
25.0
1.1
1.0
3.3
4.2
7.5
6.2
GAIL
Neutral
524
-
66,481
56,220
65,198
9.3
10.1
27.1
33.3
19.3
15.7
1.8
1.7
9.3
10.7
1.4
1.2
ONGC
Neutral
196
-
251,852
137,222
152,563
15.0
21.8
19.5
24.1
10.1
8.1
0.9
0.8
8.5
10.1
2.1
1.9
Indian Oil Corp
Neutral
391
-
190,012
373,359
428,656
5.9
5.5
54.0
59.3
7.3
6.6
1.1
1.0
16.0
15.6
0.7
0.6
Reliance Industries
Neutral
1,088
-
353,013
301,963
358,039
12.1
12.6
87.7
101.7
12.4
10.7
1.3
1.2
10.7
11.3
1.6
1.4
Pharmaceuticals
Alembic Pharma
Neutral
593
-
11,182
3,483
4,083
20.2
21.4
24.3
30.4
24.4
19.5
5.6
4.4
25.5
25.3
3.1
2.6
Stock Watch
February 22, 2017
Company Name
Reco
CMP
Target
Mkt Cap
Sales ( Čcr )
OPM(%)
EPS (Č)
PER(x)
P/BV(x)
RoE(%)
EV/Sales(x)
(Č)
Price ( Č)
( Č cr )
FY17E
FY18E
FY17E
FY18E
FY17E
FY18E
FY17E
FY18E
FY17E
FY18E
FY17E
FY18E
FY17E
FY18E
Pharmaceuticals
Alkem Laboratories Ltd
Neutral
2,000
-
23,914
6,050
6,839
18.7
19.8
80.0
88.7
25.0
22.6
5.6
4.7
22.4
20.9
3.9
3.4
Aurobindo Pharma
Buy
686
877
40,137
15,720
18,078
23.7
23.7
41.4
47.3
16.6
14.5
4.3
3.4
29.6
26.1
2.8
2.4
Aventis*
Neutral
4,186
-
9,639
2,277
2,597
17.3
18.3
149.4
172.0
28.0
24.3
4.6
3.7
25.1
28.8
3.9
3.2
Cadila Healthcare
Neutral
440
-
45,034
10,429
12,318
22.6
22.0
16.9
19.2
26.0
22.9
6.6
5.3
28.5
25.7
4.3
3.6
Cipla
Sell
593
465
47,673
15,378
18,089
15.7
16.8
19.3
24.5
30.7
24.2
3.6
3.2
12.3
13.9
3.3
2.7
Dr Reddy's
Neutral
2,899
-
48,027
16,043
18,119
20.8
22.4
112.4
142.9
25.8
20.3
3.5
3.0
14.1
15.9
3.0
2.6
Dishman Pharma
Neutral
229
-
3,698
1,718
1,890
22.7
22.8
9.5
11.3
24.1
20.3
2.3
2.1
10.1
10.9
2.6
2.3
GSK Pharma*
Neutral
2,683
-
22,729
2,800
3,290
10.2
20.6
32.2
60.3
83.3
44.5
15.4
15.3
17.2
34.5
7.9
6.8
Indoco Remedies
Reduce
272
240
2,508
1,112
1,289
16.2
18.2
11.6
16.0
23.5
17.0
3.8
3.2
17.0
20.1
2.4
2.0
Ipca labs
Accumulate
554
613
6,987
3,303
3,799
15.3
15.3
17.3
19.7
32.0
28.1
2.8
2.6
9.1
9.4
2.2
2.0
Lupin
Buy
1,469
1,809
66,329
15,912
18,644
26.4
26.7
58.1
69.3
25.3
21.2
4.9
4.0
21.4
20.9
4.2
3.5
Sun Pharma
Buy
673
847
161,527
31,129
35,258
32.0
32.9
30.2
35.3
22.3
19.1
3.6
3.0
20.0
20.1
4.8
4.0
Power
Tata Power
Neutral
84
-
22,788
36,916
39,557
17.4
27.1
5.1
6.3
16.5
13.4
1.5
1.3
9.0
10.3
1.6
1.5
NTPC
Neutral
172
-
142,152
86,605
95,545
17.5
20.8
11.8
13.4
14.6
12.9
1.5
1.4
10.5
11.1
3.0
3.0
Power Grid
Accumulate
206
223
107,666
25,315
29,193
88.2
88.7
14.2
17.2
14.5
12.0
2.2
1.9
15.2
16.1
8.9
8.0
Real Estate
Prestige Estate
Buy
175
210
6,546
4,707
5,105
25.2
26.0
10.3
13.0
17.0
13.4
1.4
1.3
10.3
10.2
2.6
2.3
MLIFE
Buy
349
522
1,433
1,152
1,300
22.7
24.6
29.9
35.8
11.7
9.8
0.9
0.8
7.6
8.6
2.0
1.6
Telecom
Bharti Airtel
Neutral
363
-
145,086
105,086
114,808
34.5
34.7
12.2
16.4
29.8
22.1
2.0
1.9
6.8
8.4
2.3
2.0
Idea Cellular
Neutral
108
-
39,006
40,133
43,731
37.2
37.1
6.4
6.5
16.9
16.7
1.4
1.3
8.2
7.6
2.0
1.7
zOthers
Abbott India
Neutral
4,543
-
9,654
3,153
3,583
14.1
14.4
152.2
182.7
29.9
24.9
146.6
125.2
25.6
26.1
2.8
2.4
Asian Granito
Buy
282
351
850
1,060
1,169
12.2
12.5
12.7
15.9
22.3
17.8
2.1
1.9
9.5
10.7
1.1
1.0
Bajaj Electricals
Accumulate
258
295
2,608
4,801
5,351
5.7
6.2
10.4
13.7
24.7
18.8
3.1
2.7
12.4
14.5
0.5
0.5
Banco Products (India)
Neutral
206
-
1,472
1,353
1,471
12.3
12.4
14.5
16.3
14.2
12.6
19.6
17.7
14.5
14.6
1.0
110.3
Coffee Day Enterprises
Neutral
237
-
4,875
2,964
3,260
20.5
21.2
4.7
8.0
-
29.6
2.7
2.5
5.5
8.5
2.1
1.8
Ltd
Competent Automobiles Neutral
175
-
108
1,137
1,256
3.1
2.7
28.0
23.6
6.3
7.4
33.7
30.4
14.3
11.5
0.1
0.1
Elecon Engineering
Neutral
55
-
614
1,482
1,660
13.7
14.5
3.9
5.8
14.0
9.4
3.3
3.0
7.8
10.9
0.7
0.6
Finolex Cables
Neutral
440
-
6,735
2,883
3,115
12.0
12.1
14.2
18.6
31.0
23.7
16.5
14.4
15.8
14.6
2.0
1.8
Garware Wall Ropes
Accumulate
659
710
1,441
863
928
15.1
15.2
36.4
39.4
18.1
16.7
3.3
2.8
17.5
15.9
1.6
1.5
Goodyear India*
Neutral
712
-
1,641
1,598
1,704
10.4
10.2
49.4
52.6
14.4
13.5
66.5
58.3
18.2
17.0
0.7
98.8
Stock Watch
February 22, 2017
Company Name
Reco
CMP
Target
Mkt Cap
Sales ( Čcr )
OPM(%)
EPS (Č)
PER(x)
P/BV(x)
RoE(%)
EV/Sales(x)
(Č)
Price ( Č)
( Č cr )
FY17E
FY18E
FY17E
FY18E
FY17E
FY18E
FY17E
FY18E
FY17E
FY18E
FY17E
FY18E
FY17E
FY18E
zOthers
Hitachi
Neutral
1,388
-
3,774
2,081
2,433
8.8
8.9
33.4
39.9
41.6
34.8
33.5
27.9
22.1
21.4
1.8
1.5
HSIL
Neutral
293
-
2,116
2,384
2,515
15.8
16.3
15.3
19.4
19.1
15.1
19.0
16.4
7.8
9.3
1.1
1.0
Interglobe Aviation
Neutral
842
-
30,419
21,122
26,005
14.5
27.6
110.7
132.1
7.6
6.4
45.5
32.5
168.5
201.1
1.4
1.1
Jyothy Laboratories
Neutral
359
-
6,521
1,440
2,052
11.5
13.0
8.5
10.0
42.2
35.9
10.2
9.5
18.6
19.3
4.8
3.4
Kirloskar Engines India
Neutral
350
-
5,064
2,554
2,800
9.9
10.0
10.5
12.1
33.4
28.9
14.0
13.2
10.7
11.7
1.6
1.4
Ltd
Linc Pen & Plastics
Neutral
256
-
379
382
420
9.3
9.5
13.5
15.7
19.0
16.3
3.3
2.8
17.1
17.3
1.1
0.9
M M Forgings
Neutral
465
-
562
546
608
20.4
20.7
41.3
48.7
11.3
9.6
63.8
56.4
16.6
17.0
0.9
0.8
Manpasand Bever.
Neutral
702
-
4,019
836
1,087
19.6
19.4
16.9
23.8
41.6
29.5
5.0
4.4
12.0
14.8
4.5
3.4
Mirza International
Accumulate
93
107
1,121
1,024
1,148
18.0
18.0
6.9
8.0
13.5
11.6
2.3
1.9
16.6
16.3
1.3
1.1
MT Educare
Neutral
95
-
379
366
417
17.7
18.2
9.4
10.8
10.2
8.8
2.3
2.0
22.2
22.3
0.9
0.8
Narayana Hrudaya
Neutral
327
-
6,686
1,873
2,166
11.5
11.7
2.6
4.0
123.7
82.5
7.6
6.9
6.1
8.3
3.7
3.2
Navkar Corporation
Buy
166
265
2,371
369
561
42.9
42.3
7.2
11.5
23.0
14.4
1.7
1.5
7.4
10.5
7.4
4.9
Navneet Education
Neutral
141
-
3,297
1,062
1,147
24.0
24.0
6.1
6.6
23.2
21.3
4.8
4.2
20.6
19.8
3.2
2.9
Nilkamal
Neutral
1,738
-
2,593
1,995
2,165
10.7
10.4
69.8
80.6
24.9
21.6
99.3
86.3
16.6
16.5
1.3
1.2
Page Industries
Neutral
14,358
-
16,015
2,450
3,124
20.1
17.6
299.0
310.0
48.0
46.3
319.8
244.1
47.1
87.5
6.6
5.2
Parag Milk Foods
Neutral
224
-
1,884
1,919
2,231
9.3
9.6
9.5
12.9
23.7
17.3
3.7
3.0
15.5
17.5
1.1
1.0
Quick Heal
Neutral
258
-
1,807
408
495
27.3
27.0
7.7
8.8
33.3
29.3
3.1
3.1
9.3
10.6
3.6
3.0
Radico Khaitan
Accumulate
137
147
1,816
1,667
1,824
13.0
13.2
6.7
8.2
20.5
16.7
1.9
1.7
9.0
10.2
1.5
1.3
Relaxo Footwears
Neutral
422
-
5,070
2,085
2,469
9.2
8.2
7.6
8.0
55.8
53.1
21.6
18.5
17.9
18.8
2.5
2.2
S H Kelkar & Co.
Neutral
305
-
4,405
1,036
1,160
15.1
15.0
6.1
7.2
49.9
42.4
5.3
4.9
10.7
11.5
4.1
3.6
Siyaram Silk Mills
Neutral
1,716
-
1,608
1,652
1,857
11.6
11.7
92.4
110.1
18.6
15.6
2.7
2.4
14.7
15.2
1.2
1.1
Styrolution ABS India*
Neutral
605
-
1,064
1,440
1,537
9.2
9.0
40.6
42.6
14.9
14.2
38.1
34.6
12.3
11.6
0.7
0.6
Surya Roshni
Neutral
190
-
833
3,342
3,625
7.8
7.5
17.3
19.8
11.0
9.6
20.9
16.8
10.5
10.8
0.5
0.5
Team Lease Serv.
Neutral
859
-
1,468
3,229
4,001
1.5
1.8
22.8
32.8
37.7
26.1
4.0
3.5
10.7
13.4
0.4
0.3
The Byke Hospitality
Neutral
183
-
733
287
384
20.5
20.5
7.6
10.7
24.1
17.1
5.0
4.1
20.7
23.5
2.6
1.9
Transport Corporation of
Neutral
204
-
1,564
2,671
2,911
8.5
8.8
13.9
15.7
14.7
13.0
2.0
1.8
13.7
13.8
0.7
0.6
India
TVS Srichakra
Neutral
3,081
-
2,359
2,304
2,614
13.7
13.8
231.1
266.6
13.3
11.6
346.2
272.6
33.9
29.3
1.0
0.9
UFO Moviez
Neutral
415
-
1,146
619
685
33.2
33.4
30.0
34.9
13.9
11.9
1.9
1.7
13.8
13.9
1.6
1.2
Visaka Industries
Neutral
223
-
355
1,051
1,138
10.3
10.4
21.0
23.1
10.6
9.7
28.6
26.8
9.0
9.2
0.6
0.6
Stock Watch
February 22, 2017
Company Name
Reco
CMP
Target Mkt Cap
Sales ( Čcr )
OPM(%)
EPS (Č)
PER(x)
P/BV(x)
RoE(%)
EV/Sales(x)
(Č)
Price ( Č)
( Č cr )
FY17E FY18E FY17E FY18E FY17E FY18E FY17E FY18E FY17E FY18E FY17E FY18E FY17E FY18E
zOthers
VRL Logistics
Neutral
291
-
2,653
1,902
2,119
16.7
16.6
14.6
16.8
20.0
17.3
4.4
3.8
21.9
22.2
1.5
1.3
Wonderla Holidays
Neutral
374
-
2,114
287
355
38.0
40.0
11.3
14.2
33.1
26.4
4.7
4.2
21.4
23.9
7.1
5.7
Source: Company, Angel Research; Note: *December year end; #September year end; &October year end; Price as on February 21, 2017
Market Outlook
February 22, 2017
Research Team Tel: 022 - 39357800
DISCLAIMER
Angel Broking Private Limited (hereinafter referred to as “Angel”) is a registered Member of National Stock Exchange of India
Limited,Bombay Stock Exchange Limited and Metropolitan Stock Exchange Limited. It is also registered as a Depository Participant with
CDSL and Portfolio Manager with SEBI. It also has registration with AMFI as a Mutual Fund Distributor. Angel Broking Private Limited is a
registered entity with SEBI for Research Analyst in terms of SEBI (Research Analyst) Regulations, 2014 vide registration number
INH000000164. Angel or its associates has not been debarred/ suspended by SEBI or any other regulatory authority for accessing
/dealing in securities Market. Angel or its associates/analyst has not received any compensation / managed or
co-managed public offering of securities of the company covered by Analyst during the past twelve months.
This document is solely for the personal information of the recipient, and must not be singularly used as the basis of any investment
decision. Nothing in this document should be construed as investment or financial advice. Each recipient of this document should make
such investigations as they deem necessary to arrive at an independent evaluation of an investment in the securities of the companies
referred to in this document (including the merits and risks involved), and should consult their own advisors to determine the merits and
risks of such an investment.
Reports based on technical and derivative analysis center on studying charts of a stock's price movement, outstanding positions and
trading volume, as opposed to focusing on a company's fundamentals and, as such, may not match with a report on a company's
fundamentals. Investors are advised to refer the Fundamental and Technical Research Reports available on our website to evaluate the
contrary view, if any.
The information in this document has been printed on the basis of publicly available information, internal data and other reliable
sources believed to be true, but we do not represent that it is accurate or complete and it should not be relied on as such, as this
document is for general guidance only. Angel Broking Pvt. Limited or any of its affiliates/ group companies shall not be in any way
responsible for any loss or damage that may arise to any person from any inadvertent error in the information contained in this report.
Angel Broking Pvt. Limited has not independently verified all the information contained within this document. Accordingly, we cannot
testify, nor make any representation or warranty, express or implied, to the accuracy, contents or data contained within this document.
While Angel Broking Pvt. Limited endeavors to update on a reasonable basis the information discussed in this material, there may be
regulatory, compliance, or other reasons that prevent us from doing so.
This document is being supplied to you solely for your information, and its contents, information or data may not be reproduced,
redistributed or passed on, directly or indirectly.
Neither Angel Broking Pvt. Limited, nor its directors, employees or affiliates shall be liable for any loss or damage that may arise from
or in connection with the use of this information.